The Great Recession entailed a huge rise in unemployment; that is easy to track, as it is prominently featured in the monthly Bureau of Labor Statistics releases and is soon thereafter up on the St. Louis Fed FRED data site. Almost as well known is the rise in workers on (involuntary) short hours. That sort of correction is standard, reflected in the "U-6" series of "alternative measures of underutilization."
During the current US recession workers also dropped out of the labor force in unprecedented numbers. While that is a major component of adjustment to business cycles in Japan (and unemployment a smaller component), that has not been the case for the US. During the 2001 recession, employment as a share of the population for the middle of the labor market (ages 30-54) fell by 1.7 points. In contrast, between January 2007 and January 2010 the ratio fell by 5.1 points.
During the past decade, however, the age composition of the population shifted markedly; above all, the baby boomers are now entering retirement. This makes it more difficult to summarize in a single number. But it also turns out that the dynamics across different cohorts are quite different. My own prior was that the Great Recession led to a wave of early retirements, which would show up as a drop in the ration of employment to population. In fact, the ratio rose rather than fell.
This brief note focuses on presenting the data.
It also combines age-specific employment rates with Census Bureau population projections to project future "normal" employment.Data and Methods
Employment rates by age are available as time series from the Current Population Series on the BLS web site. (See the appendix for the series names.) Specifically, data are available by 5-year brackets (age 16-19 through age 70-74 and then age 75+) on a monthly basis beginning in January 1994. Data are not seasonally adjusted, but visual examination suggests these series have only a modest (and irregular) seasonal component so I have not imposed my own corrections. Because I am interested in the impact of the recession, I construct a (Paasche index) project using a base period (here January 2007) with age-specific brackets and the population in each bracket to project future "normal" employment.
∑ (ratiot x popt)
------------------ x 100 = employment-population index
∑ (ratiobase x popt)
In particular, given the changing age structure of the population, what number of jobs would be needed to return us to the January 2007 ratio of employment to population? (I have not extended data backwards.)
Now these data should be viewed as providing an additional snapshot. I limited my effort to data readily downloadable from the BLS web site. As a result I make no attempt to examine how employment ratios differ by gender, race and education, nor do I distinguish part-time from full-time labor.1 In addition, I have not compared these data to the more commonly used participation data, which are also available by age bracket. No single number or even modest set of numbers can capture more than a few angles of the dynamics of our labor market.
1. Internal BLS studies such as Sok (2010) utilize more detailed breakdowns for older workers; she also references labor economics studies of shifting trends in the transition to full retirement. Similarly, Rothstein (2012) examines youth (un)employment with detailed breakdowns by gender, race and education.
Age brackets
Visual inspection quickly shows that six age brackets from 25-54 are all very similar in behavior. A quick showed that the difference between high and low fell from 6 percentage points in 1994 to a relatively stable 3.5-4.0 percentage points after early 2001. Almost all of that variation is in fact due to slightly higher employment ratios at ages 30-34 and lower ratios at age 50-54; the variation between age 35-39 and 45-40 is under 1.0 percentage points.
In contrast, younger brackets exhibit a sharp fall. The employment rate among high-school age individuals exhibits a large secular decline; that among the age 20-24 bracket a smaller one. Both drop sharply with the Great Recession.
Older brackets show an opposite trend, a long-term secular rise. Strikingly, these are the only age brackets to exhibit no decline during course of recession. Sok (2010) speculates that this trend may reflect the shift towards defined contribution retirement plans.
Pseudo-cohorts
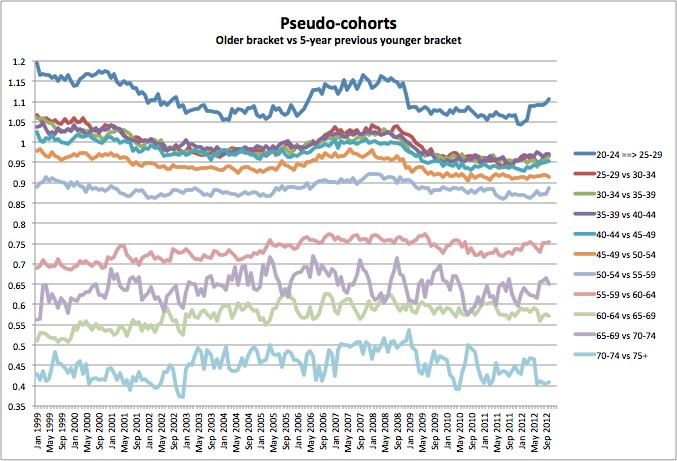
Pseudo-cohort data – comparing behavior in a bracket with the the next-older bracket 5 years later – can highlight qualitative changes in labor markets.2 In Japanese data there is a pronounced rise in female LF participation starting at 20-24, which is then followed with a lag by a rise in the age 25-29 bracket, and now in the age 30-34 bracket. In other words, in the pseudo-cohort women are increasingly exhibiting "career" behavior rather than dropping out of the labor market with marriage and child-rearing. In Japan there are also smaller systematic changes in older male cohorts.
The data I use here do not break down employment rates by gender. In the more aggregate US data, visual analysis reveals no patterns as striking as those in Japan. Overall there are modest trend toward declining transition probabilities in the 1999-2001, decreasing from above 1.0 toward 1.0. This probably reflects a tailing off of the rise in female employment rates. There is a modest rise in older brackets. For example, in about 70% of the age 55-59 bracket in 1994 were still working in 1999, when they were age 60-64. By 2005 that had risen to 75%. There is also a 5 percentage point rise going from age 60-64 to age 65-69. This is a restatement of the rise in employment rates among older workers noted above. However, all series are noisy and there are no clear changes after 2005.
2. A true cohort analysis would track individuals across time. Pseudo-cohorts tracks large averages so may be confounded by trends at the individual level that cancel each other, and by changes at frequencies shorter than the available 5-year increments.
Projections of Future "normal" employment
I previously did a quick and crude constant growth rate projection of "normal" employment based on the rate of employment growth prior to the commencement of the Great Recession in early 2007. However, because of the rapidly shifting age structure of the US population, a simple projection will overstate "needed" employment. Indeed, the 2008 National Population Projection suggests that 2007 is the break point; the aging of the baby boomers began exerting its effect just at the start of the Great Recession.
To estimate "normal" future employment I thus use the January 2007 employment-population ratios as a base and multiply the projected population in each 5-year age bracket by the relevant ratio. The employed population grew at a steady 1.0% during 2001-2006; over the 10 years 1997-2006 it grew an average of 1.3%. However, using the population projections with the January 2007 base, employment growth falls, from 0.9% in 2007 to 0.5% in 2013. As a result, using realistic population projections lowers the anticipated number of employed in 2016 by 5.2 million relative to a simple constant growth projection. The decline would be greater if we limited the analysis to workers aged 25-64, as between 2007 and 2017 the aging of the baby boomers leads to a projected 2.4 million rise in workers age 65+.
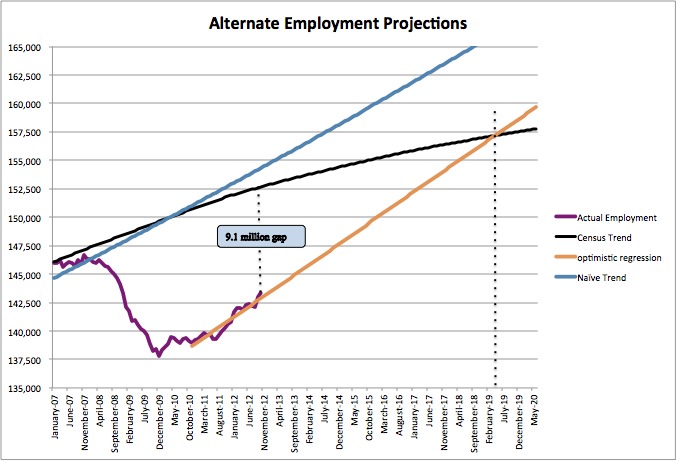
The attached graphs provide two simple analyses using this series. One compares actual employment relative to the projected "normal" level of employment. Projecting recent net job creation into the future, this shows that the economy will return to normality in early 2019; a similar projection of employment less those on involuntary short hours provides a similar date for full recovery from the Great Recession. Both imply that in the end this process will have required a full dozen years.
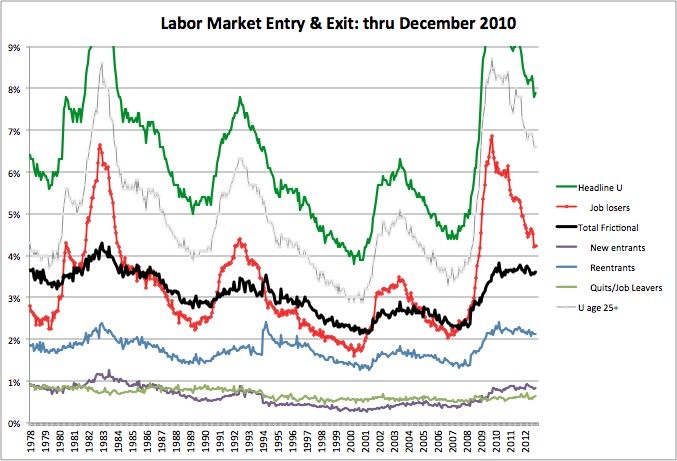
Note that the jobs gap is smaller than the current level of unemployment. That is because even in good times an economy exhibits frictional unemployment, reflecting the normal churn in labor markets as young workers enter the market, and current workers quit to search for better jobs and lose their jobs because of structural shifts in the economy and as firms fire people and search for better workers. Even at the peak of the housing bubble – Oct-Dec 2006 – unemployment never fell below 4.4% or 6.7 million workers. As of October 2012, unemployment was 5.5 million workers higher, while my projection of employment rates suggests that, reflecting exit from the labor force, the true gap is 9.1 million.
Conclusion
Examining employment rates provides a different picture from other metrics, such as age-specific unemployment rates. In particular, employment rates have not fallen among older workers, in contrast to younger workers. Are employers substituting older (and probably part-time) workers for young (and possibly part-time) workers? or does the human capital of older workers render young workers poor substitutes, so that a tightening of labor markets will not lead directly to an increase in demand for younger workers? These are clearly important topics, but I have not searched EconPapers for recent work on these topics. My primary goal was simply to give a quick overview of the data, and then to use them to
Bibliography
Rothstein, Donna S. (2012). "Young adult employment during the recent recession." Issues in Labor Statistics, 12(02).
Sok, Emy (2010). "Record unemployment among older workers does not keep them out of the job market." Issues in Labor Statistics, 10(04).
Employment Trend vs Census-adjusted Trend |
 |
Employment trend subtracting workers on (involuntary) short hours |
 |
Frictional Unemployment |
 |
Employment-Population Ratios by Age Bracket: Index |
 |
Employment-Population Ratios by Age Bracket: Levels |
 |
Pseudo-cohort transition rates |
 |
Narrowing of Variation in Employment Rates in Core |
 |
Projected Employment January 2007 Age-specific Employment Rates and 2009 Census Population Projections | |||
Projected Employment Levels | Increment | Percent growth | |
2000 | 137,282,140 | - | - |
2001 | 138,781,310 | 1,499,170 | 1.09% |
2002 | 140,188,448 | 1,407,138 | 1.01% |
2003 | 141,539,899 | 1,351,451 | 0.96% |
2004 | 142,919,993 | 1,380,094 | 0.98% |
2005 | 144,324,153 | 1,404,160 | 0.98% |
2006 | 145,746,856 | 1,422,703 | 0.99% |
2007 | 147,002,624 | 1,255,768 | 0.86% |
2008 | 148,192,628 | 1,190,004 | 0.81% |
2009 | 149,389,459 | 1,196,831 | 0.81% |
2010 | 150,560,924 | 1,171,465 | 0.78% |
2011 | 151,681,907 | 1,120,983 | 0.74% |
2012 | 152,585,881 | 903,974 | 0.60% |
2013 | 153,392,625 | 806,744 | 0.53% |
2014 | 154,162,670 | 770,045 | 0.50% |
2015 | 154,873,642 | 710,972 | 0.46% |
2016 | 155,574,275 | 700,633 | 0.45% |
2017 | 156,183,742 | 609,466 | 0.39% |
2018 | 156,731,461 | 547,719 | 0.35% |
2019 | 157,273,686 | 542,225 | 0.35% |
2020 | 157,766,969 | 493,283 | 0.31% |
2021 | 158,338,163 | 571,195 | 0.36% |
2022 | 158,846,493 | 508,330 | 0.32% |
2023 | 159,345,716 | 499,222 | 0.31% |
2024 | 159,852,299 | 506,583 | 0.32% |
2025 | 160,311,745 | 459,446 | 0.29% |
BLS Data Series
Age Bracket | Series Name |
16-19 | LNS12300012 |
20-24 | LNS12300036 |
25-29 | LNU02324932 |
30-34 | LNU02324933 |
35-39 | LNU02324934 |
40-44 | LNU02324935 |
45-49 | LNU02324936 |
50-54 | LNU02324937 |
55-59 | LNU02300094 |
60-64 | LNU02300096 |
65-69 | LNU02324938 |
70-74 | LNU02324941 |
75+ | LNU02324942 |
...mike smitka...
No comments:
Post a Comment